What is the Product Sales Report?
The Product Sales Report is a specialized analytics dashboard that provides detailed insights into the performance of each product in your store over a selected time period. Rather than viewing revenue as a single overall figure, this report breaks performance down by individual product, helping answer key business questions such as:
- Which products are the best-selling and least-selling?
- How many units of each product have been sold?
- What percentage of total revenue does each product contribute?
- How have discounts impacted net sales?
Why is this report important?
1. Make Data-Driven Decisions
Instead of relying on assumptions when deciding which products to promote or discontinue, the report provides clear, actionable data to support every decision.
2. Optimize Inventory Management
Identify your best-selling and slow-moving products to avoid stock shortages for high-demand items while minimizing excess inventory for low-performing products.
3. Evaluate Discount Effectiveness
By comparing the Discount and Net Sales columns, you can determine whether promotional campaigns are generating meaningful returns or simply reducing profit margins without significantly increasing sales volume.
4. Compare Branch Performance
Using the Branch filter, you can analyze how specific products perform across different branches, helping you make informed decisions about local marketing efforts and inventory allocation.
5. Understand Customer Purchasing Behavior by Sales Channel and Fulfillment Method
Determine whether a product is primarily purchased through delivery or pickup, and whether orders originate from the online store or the Point of Sale (POS). These insights enable more targeted marketing strategies for each sales channel.
6. Plan Product Menus and Future Promotions
For restaurants and food businesses, this report helps optimize menus by focusing on high-performing, profitable items while gradually removing products that generate limited sales.
7. Track Product Performance Over Time
By adjusting the reporting period (weekly, monthly, or quarterly), you can monitor growth trends or performance declines for individual products—not just the overall store performance.
How to Access the Report
You can access the Product Sales Report from the left-side navigation menu under Reports, where it appears as one of the available report categories.
Once the report page opens, you'll find an organized interface that allows you to apply filters before displaying the data.
Available Filters
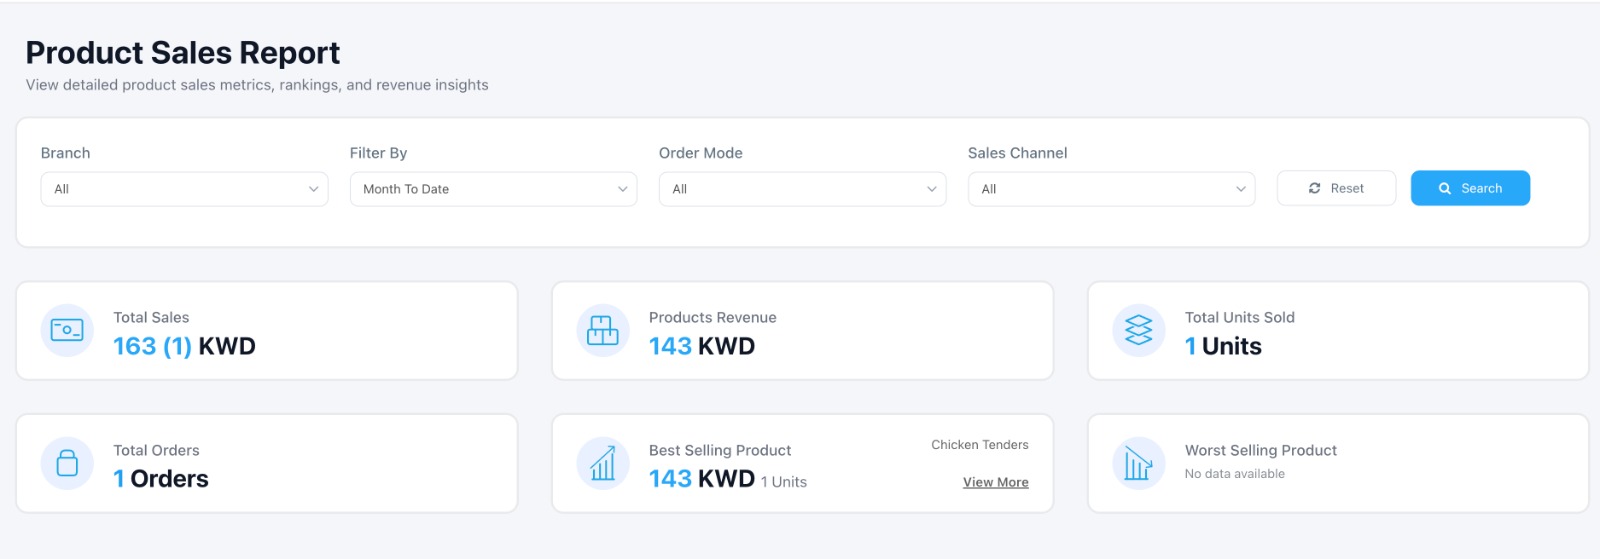
- Branch: View sales for a specific branch or all branches.
- Filter By: Filter data by a selected reporting period.
- Order Mode: Filter orders by Delivery or Pickup.
- Sales Channel: Analyze sales based on their origin, such as Online Store or Point of Sale (POS).
After selecting the desired filters, simply click Search to generate the report.
Key Performance Indicators (KPIs)
At the top of the page, summary cards provide a quick overview of overall performance:
Total Sales – Overall sales value in the store's configured currency.
Product Revenue – Total revenue generated from product sales.
Total Units Sold – Total number of product units sold.
Total Orders – Total number of orders associated with the displayed sales.
Best Selling Product(s) – The highest-performing product(s) during the selected period.
Least Selling Product(s) – The lowest-performing product(s) during the selected period.
These summary cards provide an executive-level snapshot of performance, making them ideal for quick daily or weekly reviews.
Product Sales Details
The report also provides a detailed breakdown of product revenue.
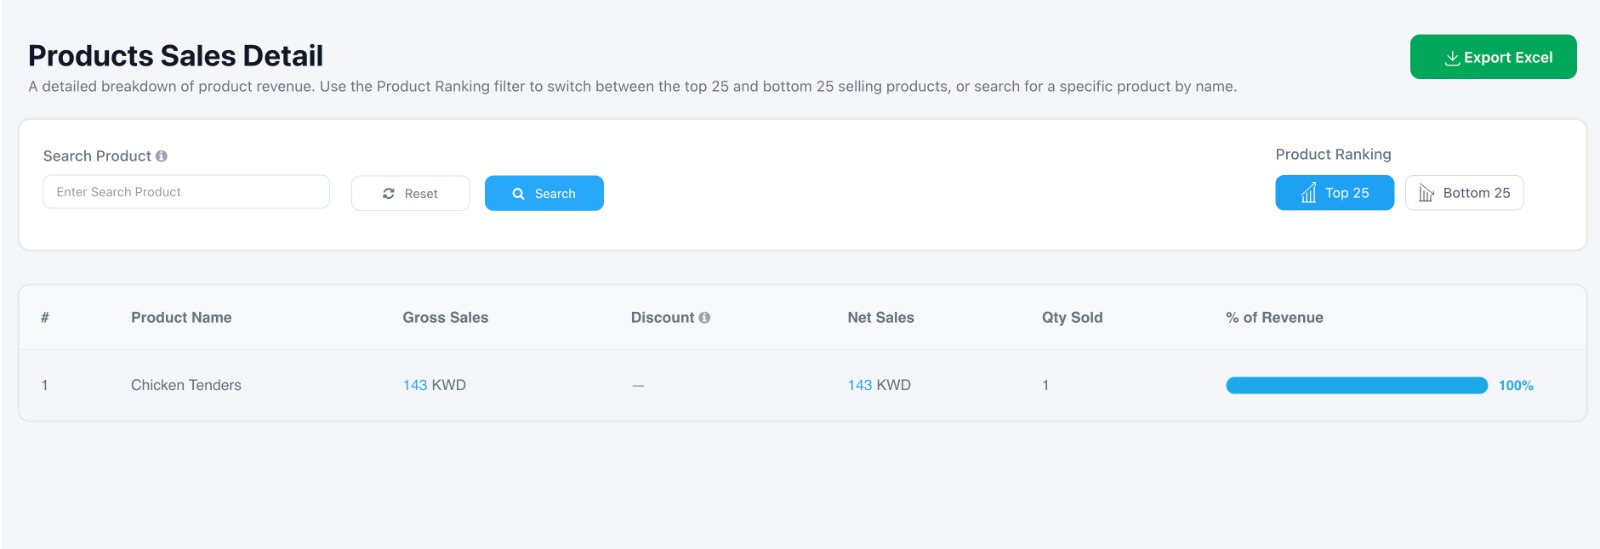
Use the Product Ranking filter to switch between the Top 25 Best-Selling Products and the Bottom 25 Least-Selling Products, or search for a specific product by name.
The detailed table includes the following columns for each product:
- Product Name: The product name as registered in the system.
- Gross Sales: Total sales value before discounts.
- Discount: Total discounts applied to the product's sales.
- Net Sales: Actual sales value after discounts.
- Quantity Sold: Total number of units sold.
- % of Revenue: The product's contribution as a percentage of the store's total revenue.